The Next-Level Tourney
How do you inspire a vast network of dealers to champion a single brand of auto parts? We did it in March!
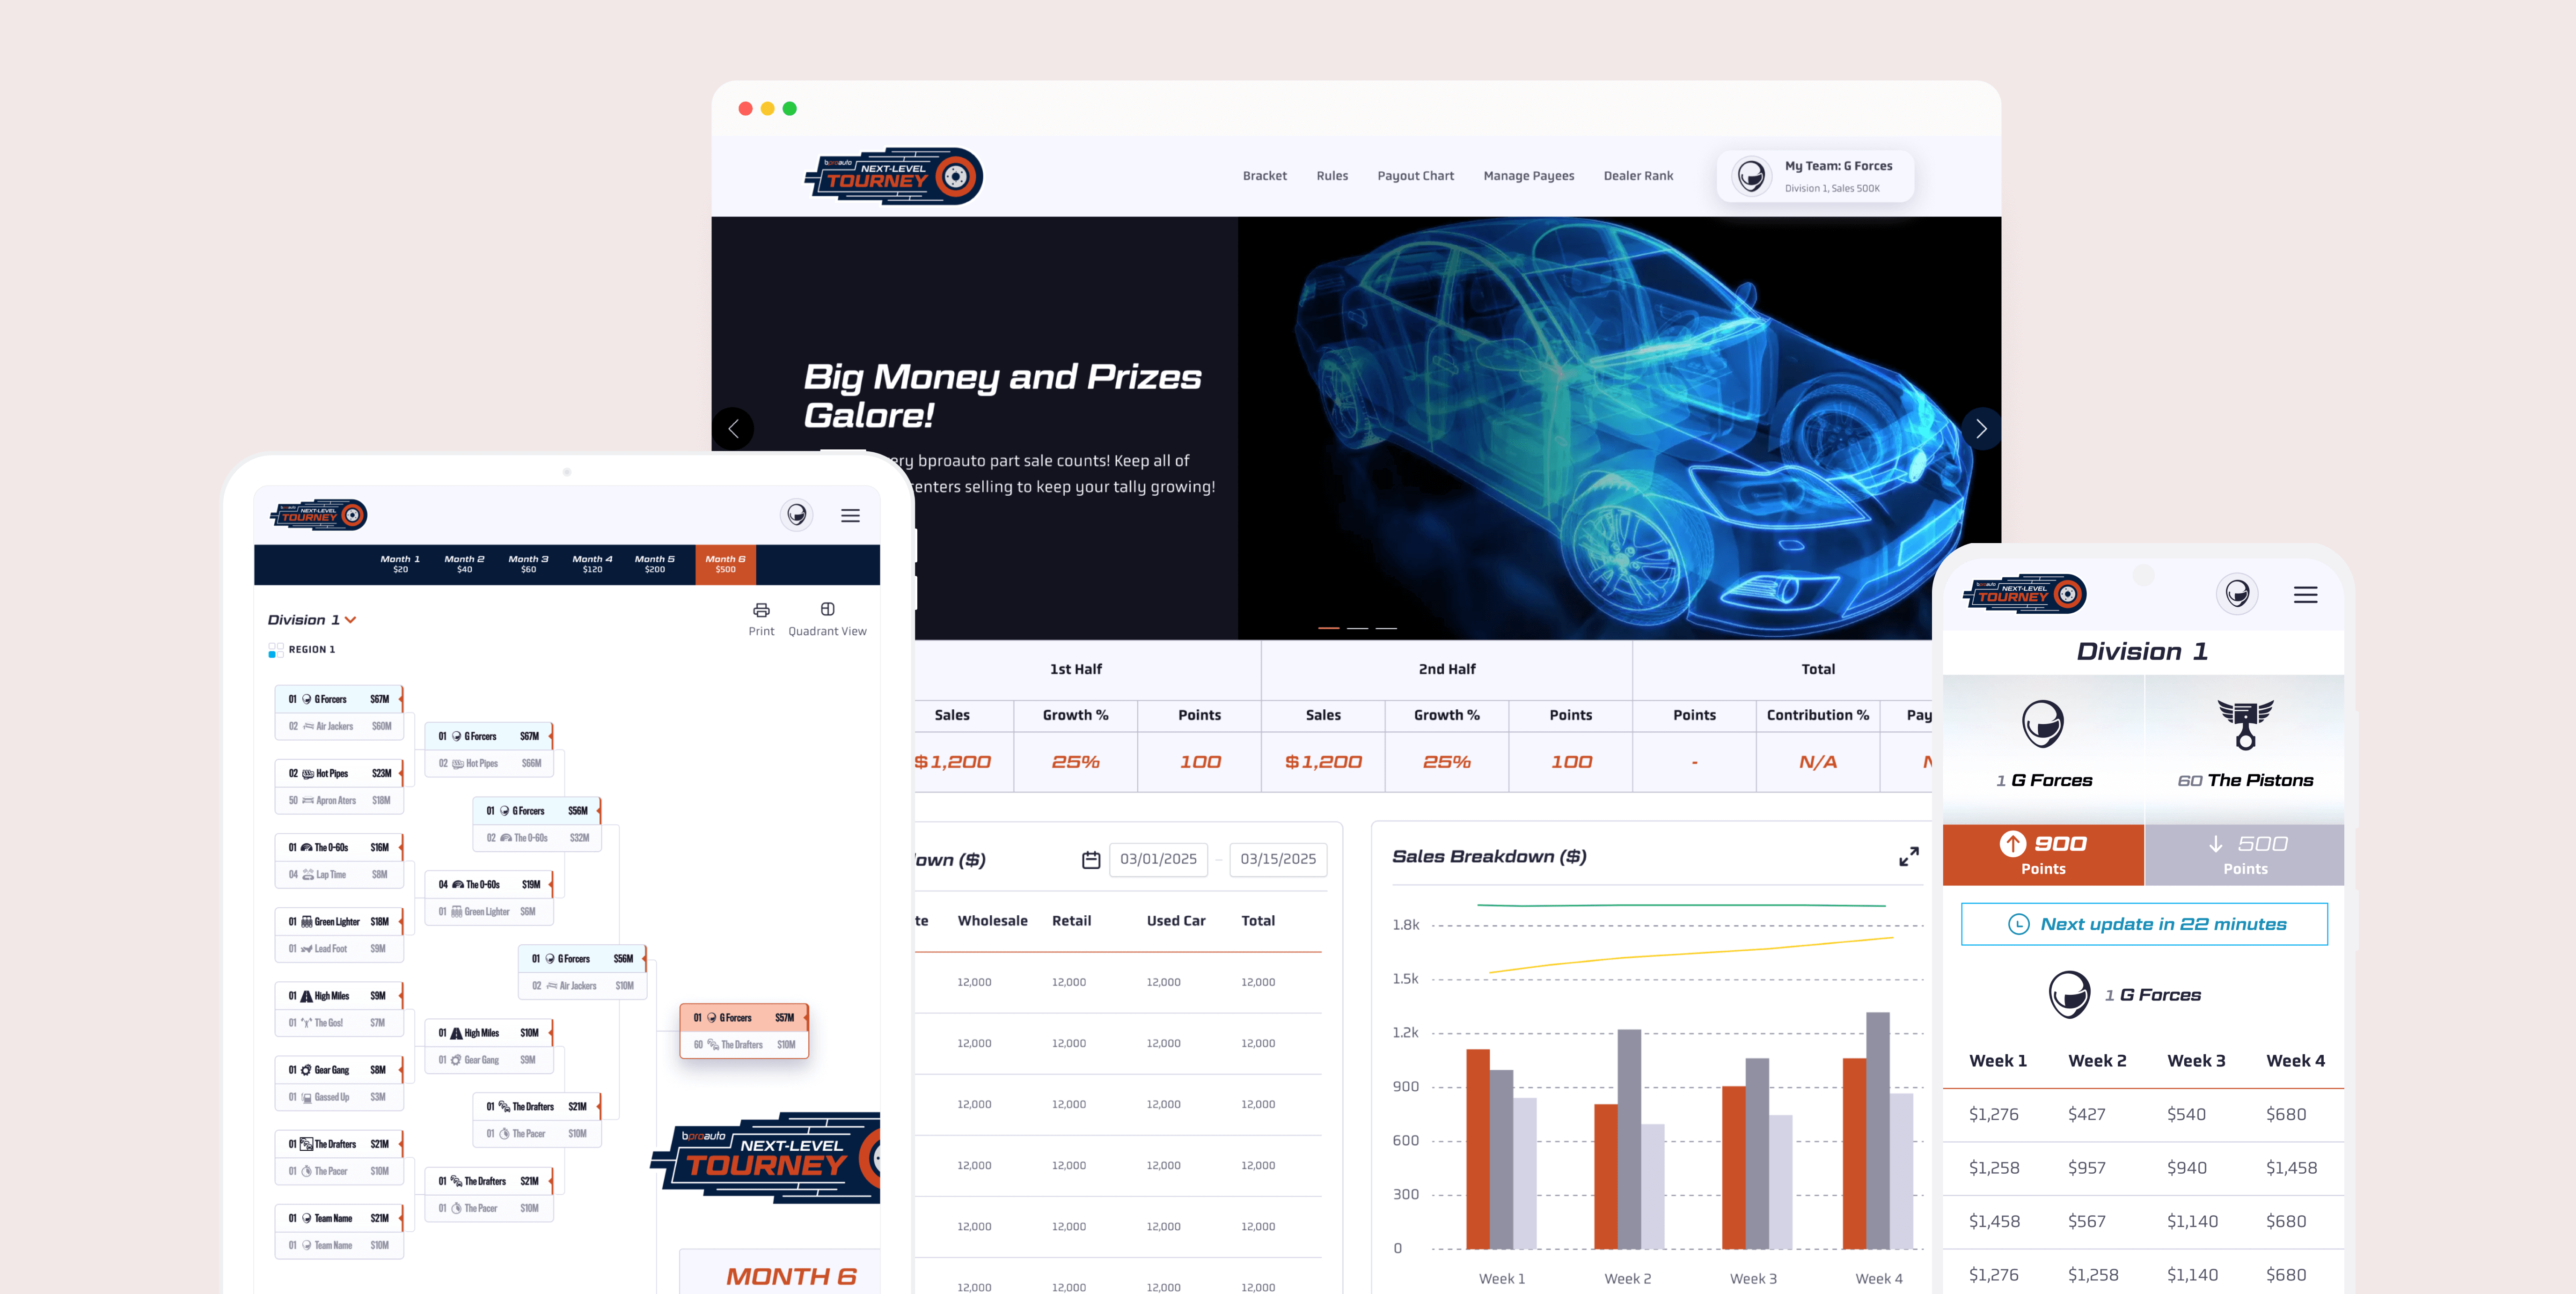
By harnessing the excitement of March Madness, we created the Next-Level Tourney – an innovative campaign that boosts performance and builds brand loyalty through sports-themed competition. Our team designed a custom website for 25,000 dealers to track live updates, sales data, and competitive rankings.
Increase in dealer
network sales
Rolling 12-week sales average increase
Dealers realized the profit margin increase on the BProAuto parts
Engagement on tourney dealer dashboard
With no product manager, our design and development teams collaborated closely and rapidly iterated in agile sprints to come up strategy and build the platform from 0 to 1.
3 Months
Product Designer
2 Product Designers
1 Creative Director
1 Account Manager
1 Project Manager
1 Copywriter
3 Developers
I played the key role in driving design process, developed the strategy, and ensured successful implementation.
Background and Challenge
BProAuto, a new and innovative auto parts brand, approached our agency with a challenge: they needed a campaign to boost dealer awareness and sales. Our agency envisioned a March Madness-style contest for selling parts—an exciting opportunity to innovate. However, innovation often comes with unknowns and challenges.
With a tight 3-month deadline, no prior experience in this area, and no product manager, we have to turn this vision into reality and building this platform from scratch. This wasn't just a one-off campaign; it was laying the groundwork for a potential annual event. We had the opportunity to set a new benchmark in the automobile industry.

Comparative Analysis
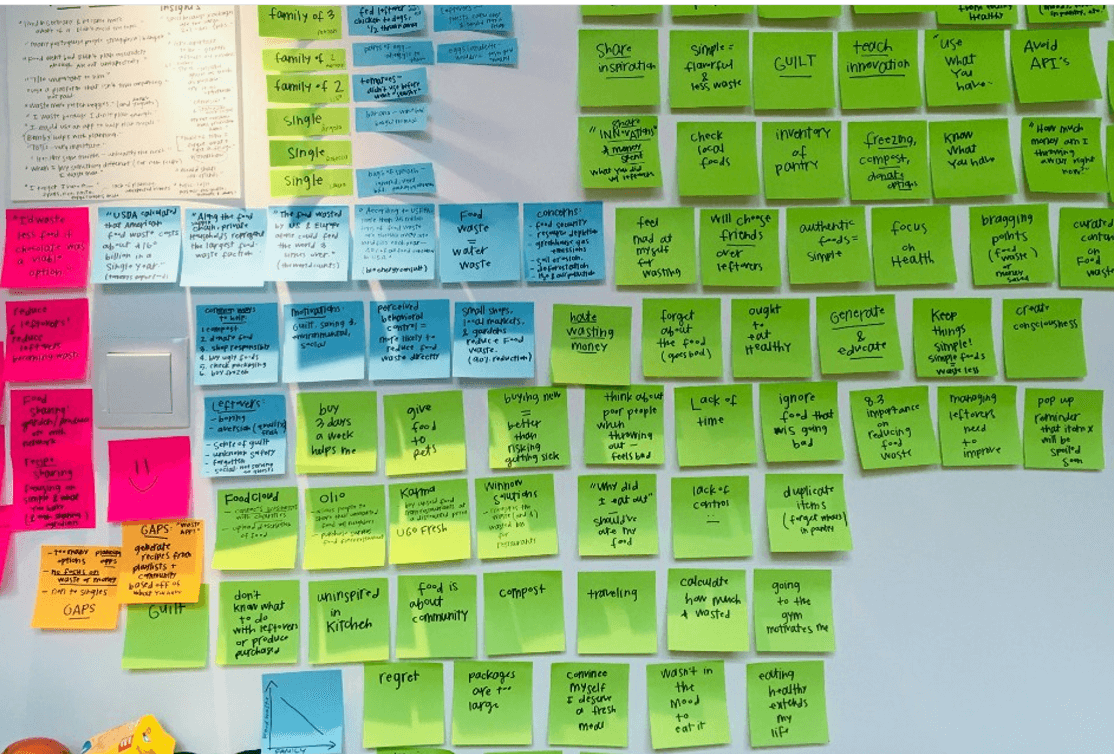
We began with just one creative idea and a blank slate. No specific requirements, no clear direction. So, we dove into research to chart our course. My fellow UX designer and I studied successful tournament bracket platforms like CBS, NCAA, ESPN, and Yahoo to gain inspiration and identify common features and UX patterns. These insights formed the foundation of our strategy and became our guiding light:


Competition
Use gamification strategies, including leaderboards and predictions, to foster a competitive spirit and motivate users to participate actively.

Engagement
Design interactive elements that draw users back frequently, such as real-time updates and clickable details, to maintain high engagement levels.

Clarity
Implement a structured, minimalistic bracket design to simplify complex sales data, allowing users to easily track their performance without feeling overwhelmed.

Inclusivity
Design for multiple devices with features like zooming, scrolling, and printable versions to cater to all users.
User Unmet Needs
Before the tournament platform existed, dealers faced critical gaps in visibility, context, and strategic direction. These unmet needs informed the foundation of our design strategy.
1
“I know my sales perforamce — but where do I stand in the market?”
Dealers lacked visibility into peer performance, especially among similar-sized stores. Without benchmarks, they couldn’t evaluate success, set competitive goals, or stay motivated through comparison.
Design Goals:
Enable peer benchmarking and anonymized comparisons across the dealer network to give context and inspire healthy competition.
2
“I have data — but it doesn’t guide my sales.”
Raw data didn’t show what actions to take. Dealers struggled to connect numbers with strategy or team alignment. Without clear insights, managers couldn’t guide teams effectively or improve results through data.
Design Goals:
Visualize performance trends, tie data to rewards, and surface actionable insights to help dealers align team efforts and drive better outcomes.
3
“As a arear manager, I had no quick way to track my dealers’ performance across the region.””
Area managers couldn’t easily access performance data across dealerships. Without a centralized view, managers couldn’t quickly spot underperforming dealers or make timely decisions to support sales and inventory strategies.
Design Goals:
Create a real-time dashboard that aggregates data across all dealerships, enabling area managers to filter, compare, and act quickly based on performance trends.
By aligning user insights with campaign goals, we transformed the tournament into a business intelligence tool that empowered dealers to act on data and boosted our client’s reputation. The result: higher sales, stronger engagement, and better business outcomes.
Diverge and Converge
When we brought the valuable insights back to the team, we quickly decided on 3 key HMWs to focus on and held a brainstorming workshop. However, we soon faced an overload of ideas and differing opinions, leading to endless discussions that made it difficult to make decisions or clarify our direction.

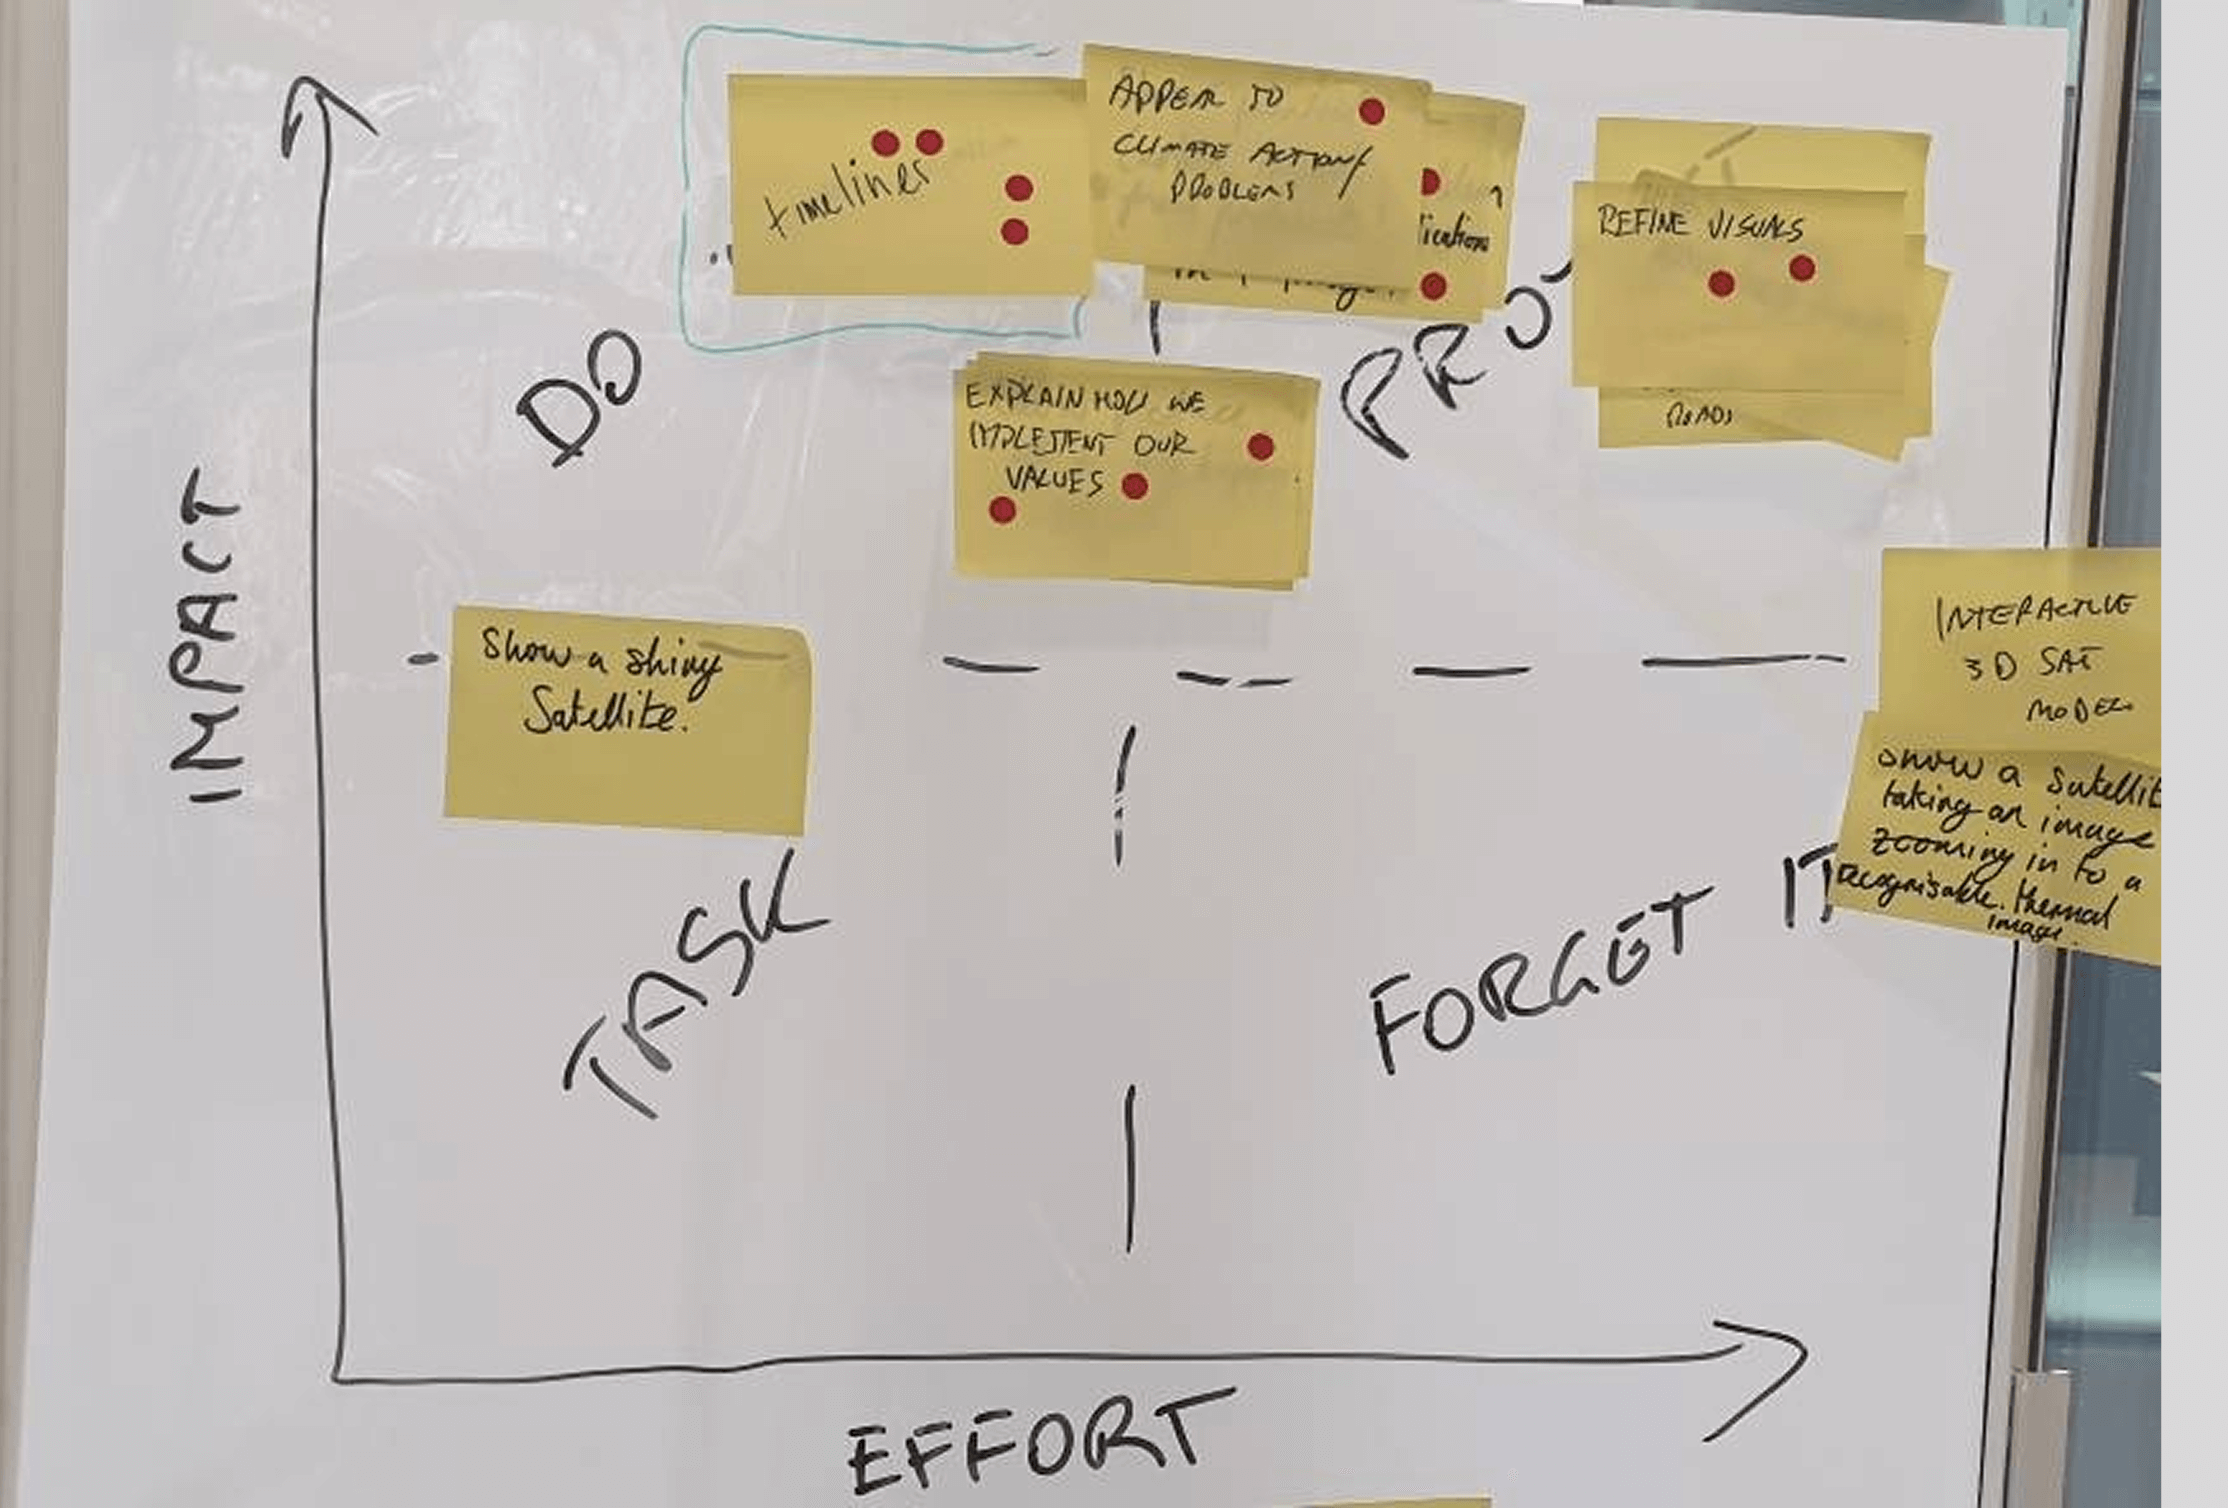
Recognizing our timeline was at risk, I introduced the decision matrix and reminded the team of key principles we agreed on from our research analysis to streamline the solution.
I also took initiative to created a sitemap and page flow, providing a visual reference to keep everyone aligned and helping our copywriter start content creation early to save time.
Challenge 1
Key Feature 1 - Bracket Game Overview
Dealers need to quickly understand their team's position, progress, and potential rewards, whether on personal devices or for team presentations. The bracket system transforms complex sales competitions into an engaging visual story. Using a familiar tournament layout, dealers quickly align with the mental model. It enables them to grasp competition status and incentives at a glance, serving as an effective tool for goal-setting and team motivation.

Responsive Design
Dealers are constantly on the move meeting vendors, clients, and customers. They will use mobile or ipad to stay updated on the sales competition in real-time. Our full bracket view worked great on large screens but became cluttered and unreadable on small screens.
Quadrant Navigation system for smaller screen
I enhance readability with intuitive quadrant navigation, allowing dealers to focus on one region at a time. They can easily swipe between columns to find their team's position and upcoming matches without feeling overwhelmed.

Bridging mobile and desktop
Recognizing the benefits of this focused view, I brought Quadrant Navigation to desktop and iPad screens. On larger screens, it acts as an interactive map within the full view, allowing dealers to maintain context while easily jumping to specific sections.

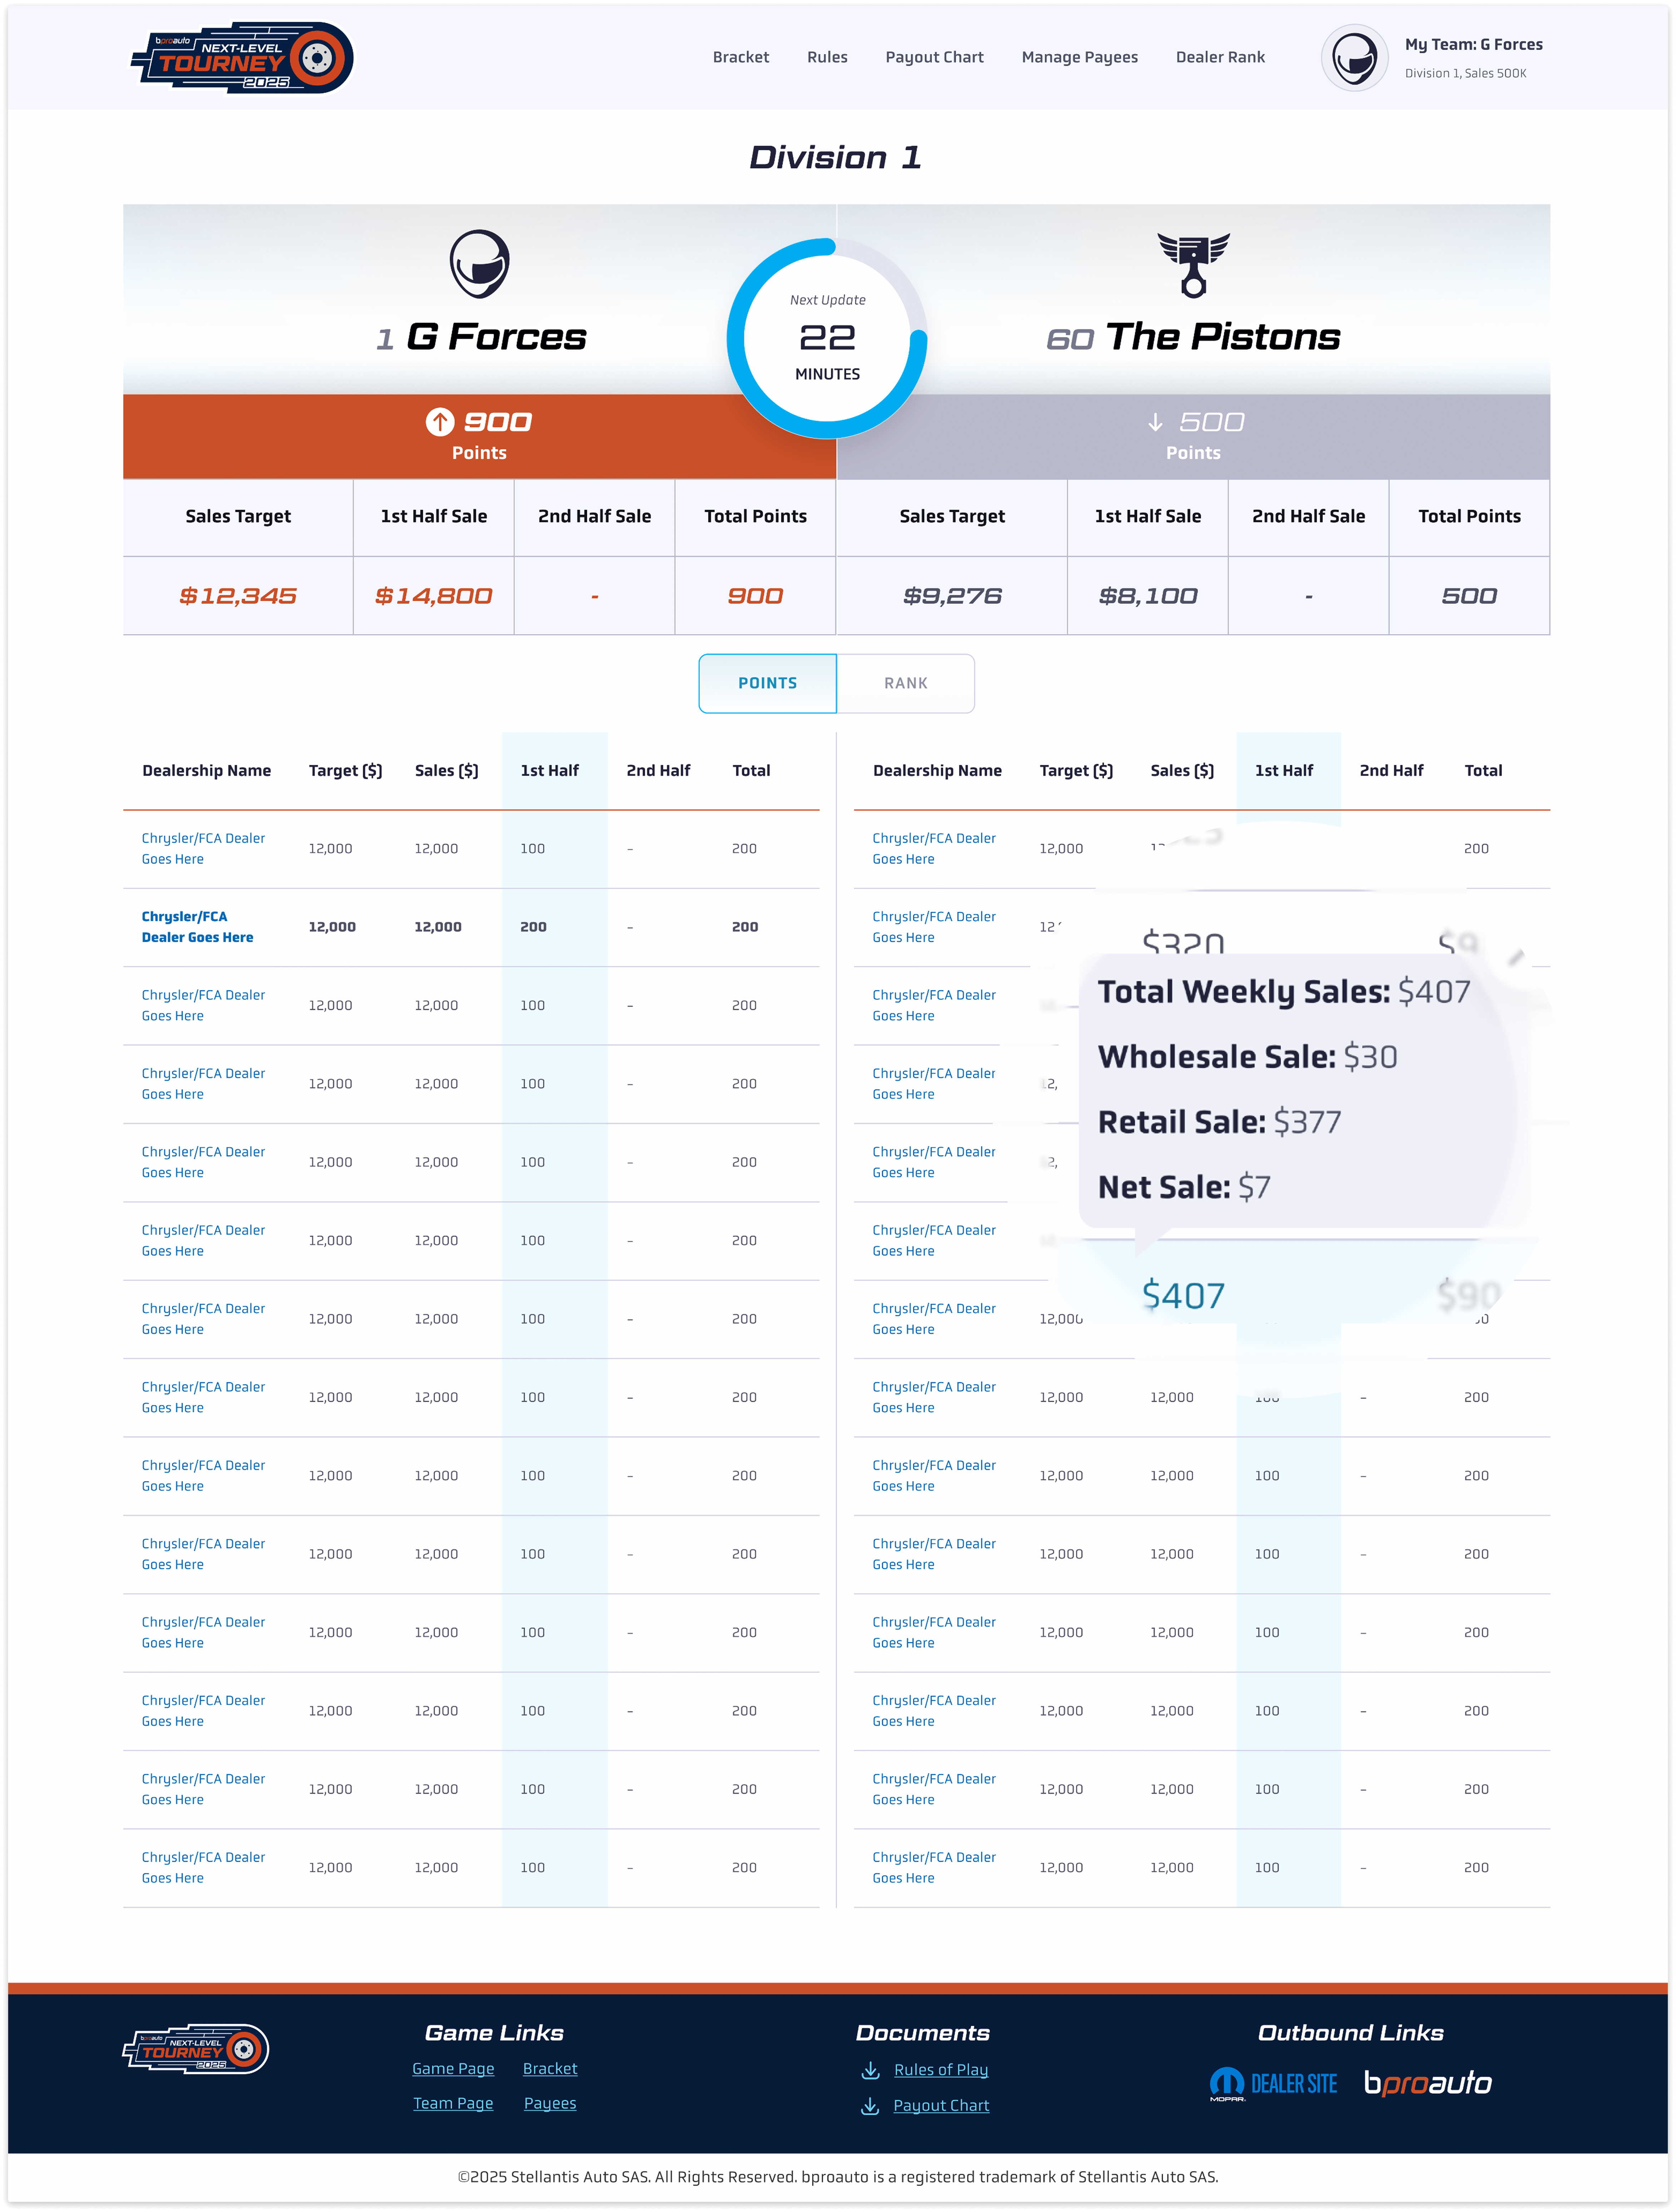
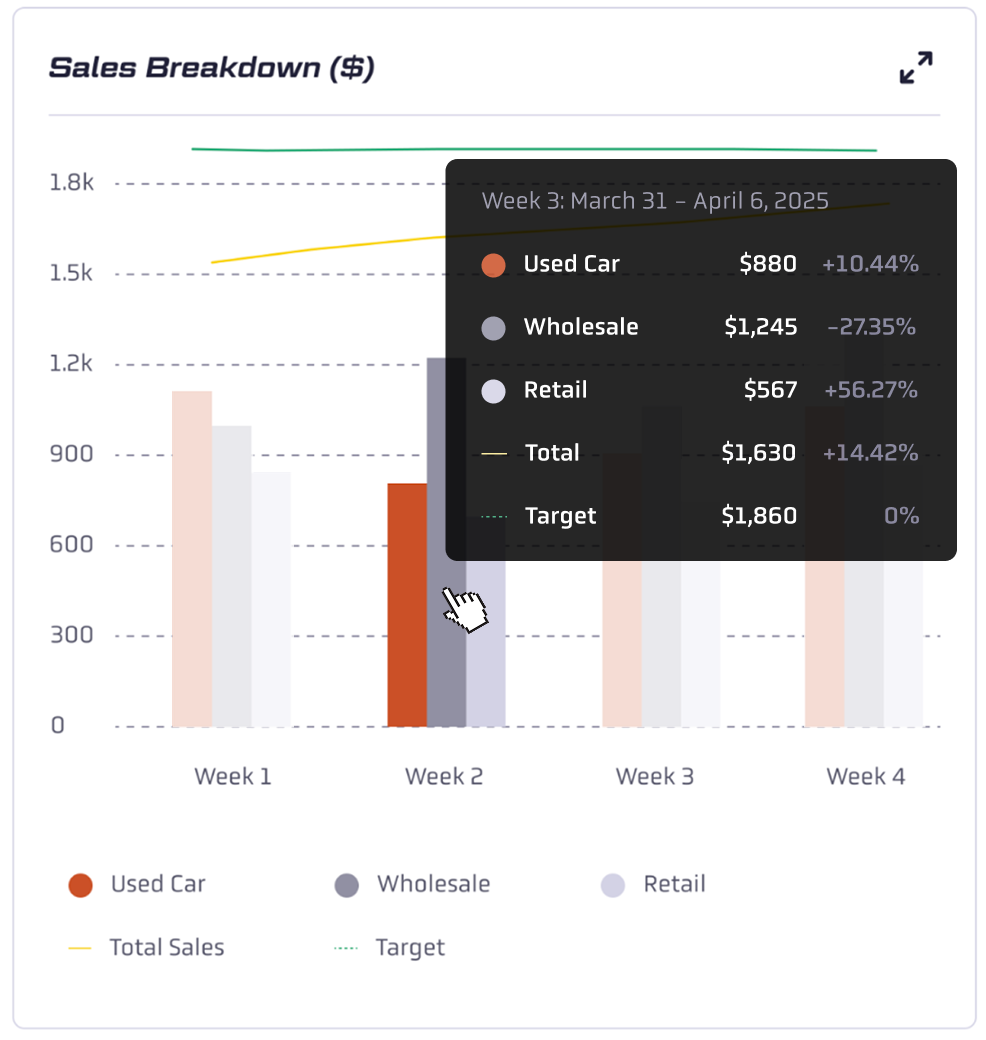
Key Feature 2 - Game Competition Details
The team competition dashboard centralizes real-time sales data, enabling dealers to directly compare team performance through clear metrics and interactive product breakdowns. The countdown timer and performance tracking create healthy competition, motivating teams to monitor trends.
Challenge 2
Dealer Sales Data Deep Dive
I invited developers to join as co-designers during the wireframe phase. Faced with complex competition data reporting, our collaboration with the technical team merged innovative design solutions with feasible implementation, enabling efficient development with minimal revisions.
Understanding sales data is crucial for dealers, but how data is presented can make or break its effectiveness.
Initially, I used a line chart (Design A) to highlight sales trends over time. However, internal testing revealed visual clutter and cognitive overload due to overlapping trend lines. Dealers found it difficult to compare performance across channels at a glance.
Design A: Line Chart without total sales and target

✅ Design B: Bar Chart with Line Trend

To address this, I pivoted to bar chart (Design B), which better aligns with dealers' primary needs—understanding weekly sales composition and comparing performance across different channels. This new visualization presents Used Car, Wholesale, and Retail sales side by side, enabling quick comparisons. The addition of total sales and target lines provides crucial context for overall performance and goal tracking.4o
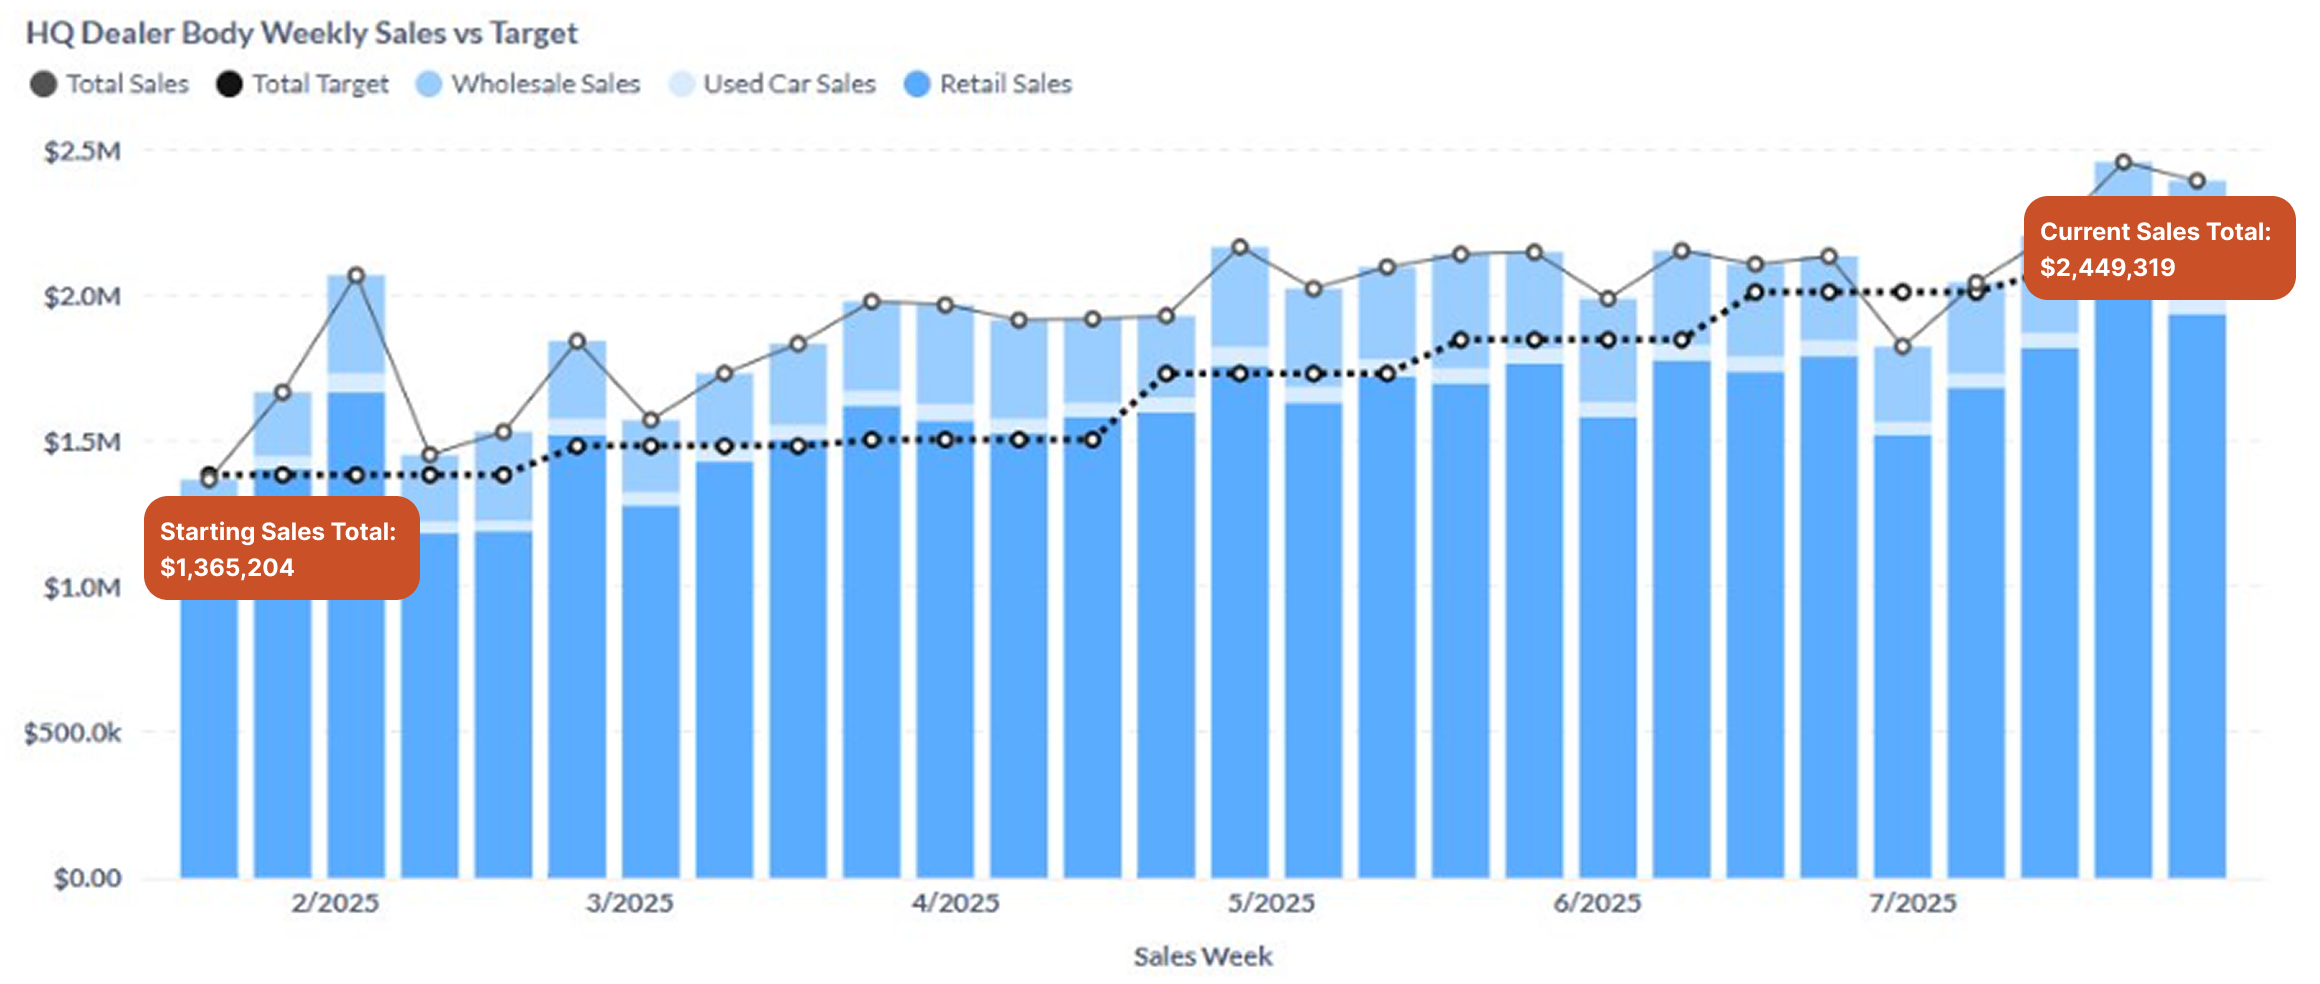
Key Feature 3 - Dealer Profile Page
Dealers struggled with fragmented data, making it hard to compare performance, track trends, and adjust strategies in real time. The sales dashboard centralizes key insights, including weekly breakdowns, growth rates, seasonal sales trends, and channel contributions. This intuitive visualization enables dealers to quickly compare performance, identify opportunities, and optimize strategies—driving better inventory planning and sales growth.

Challange 3
Key Feature 4 - Dealer Dashboard and Reporting
We designed a centralized dashboard for area managers that consolidates dealer rankings, sales targets, and real-time performance into a single view. The Dealer Dashboard quick insights into top performers, wildcard status, and sales progress, while interactive charts reveal trends across dealerships.
The Dealer Reporting page adds sortable, filterable data by region, round, or dealer. This streamlined system replaces fragmented reporting with a real-time command center — enabling managers to compare performance, track goals, and take timely action to support underperforming teams.
.png)
All Dealer Sales Data Dashboard
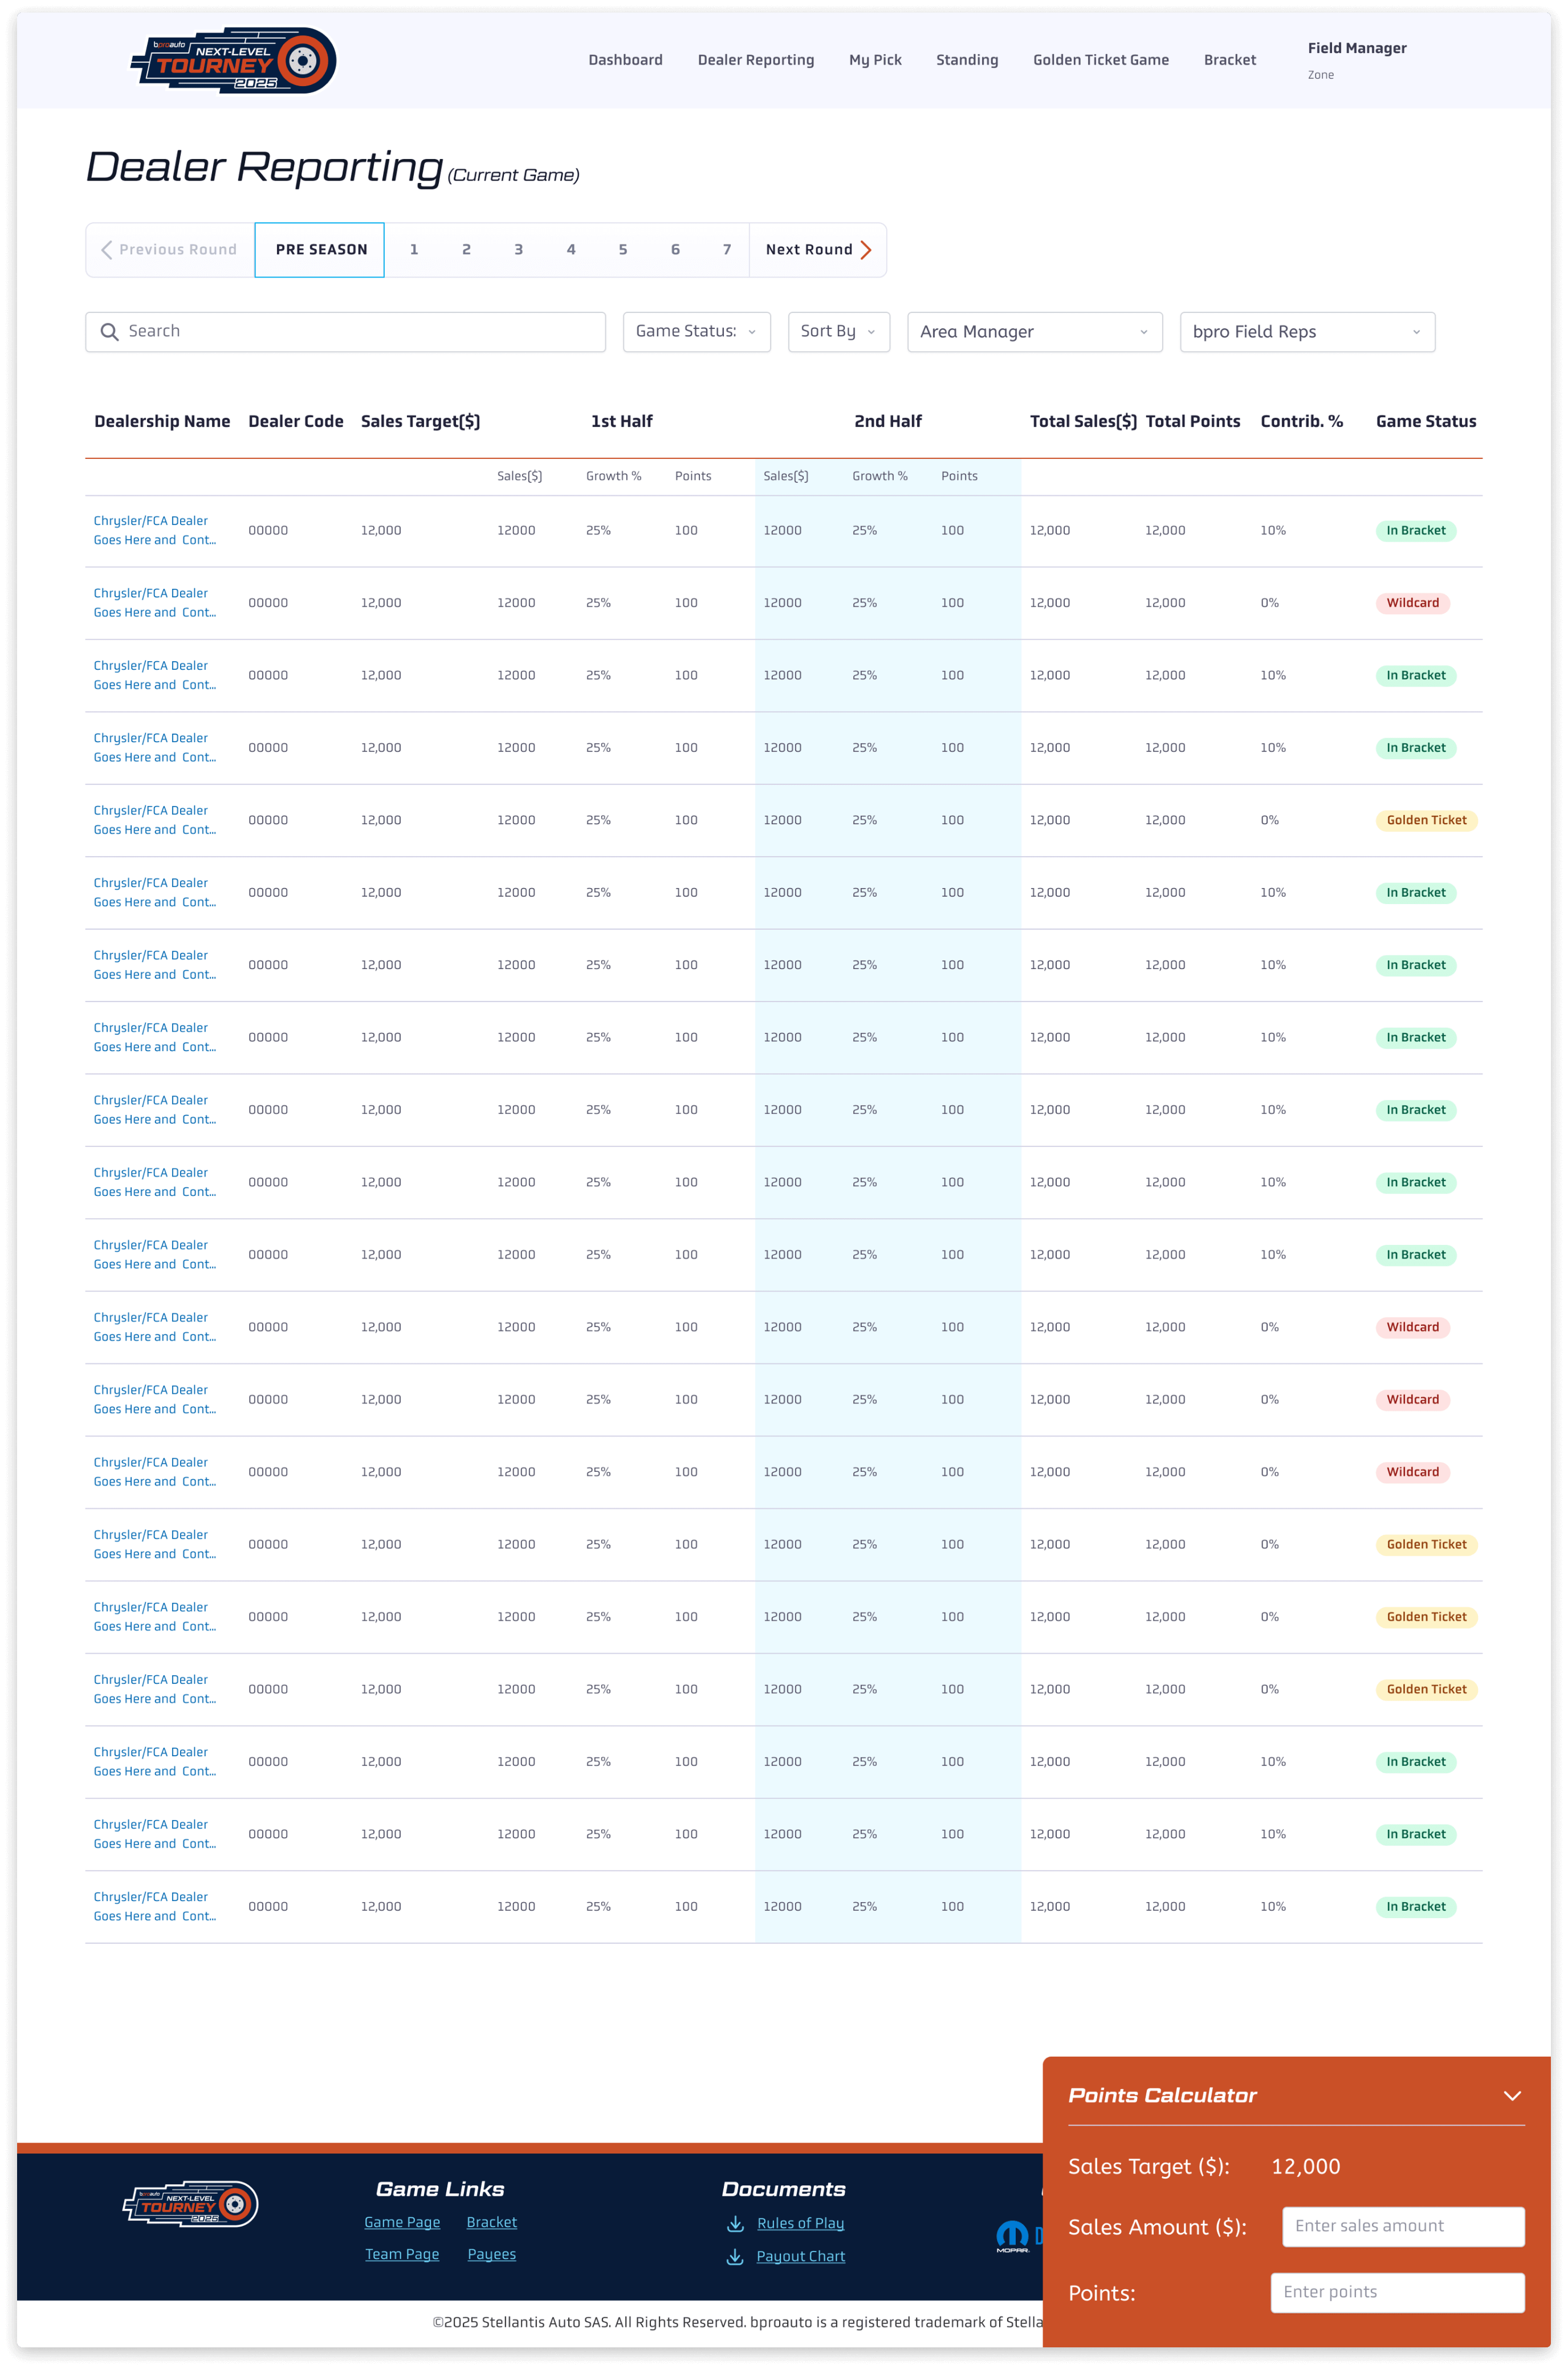
Dealer Sales Data Reporting
Impact
The Next-Level Tourney campaign was a resounding success, significantly boosting brand awareness, engagement, and sales. Participating dealers who adopted the gamified platform saw individual sales gains of 17%–40%. The BProAuto brand now ranks among the dealer platform's top 3.
Our post-campaign survey revealed high dealer satisfaction, with constructive feedback guiding our plans for more iterations and an even stronger campaign next year.
It was fun to team up and compete, with individual battles adding excitement.
The site is very user-friendly and easy to follow.
The profit margin on BProAuto was a pleasant surprise.